Long readsThe smoke
ควันไฟ
Ten months of the year this is some of the cleanest air in Thailand. Two months of the year it is not.
 National Aeronautics and Space Administration (NASA) · Public domain
What it is
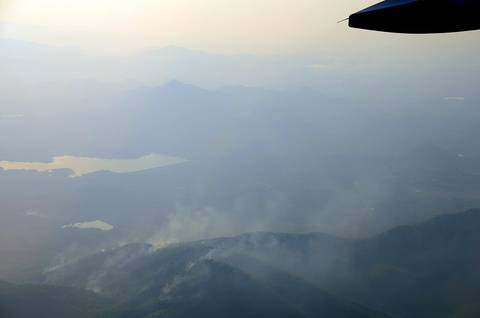
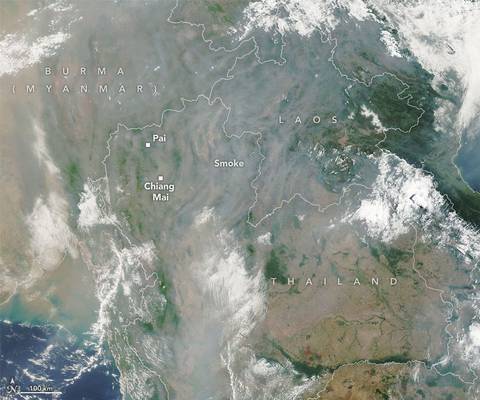
From late February the hills burn — crop residue, forest undergrowth, land clearance, on both sides of the border — and the smoke settles into exactly the valleys this road runs through. It lifts with the first rains. This page carries four years of daily figures for every town on the circuit, and says plainly where those figures are weaker than they look.
The long version
Two sources were fetched, and they are printed together because they disagree.
The long record is Copernicus CAMS through the Open-Meteo air quality service: hourly PM2.5 at ten points around the loop from 1 August 2022 to the day of the build. That is 15,050 point-days. Reduced to a daily mean and then to a month, the shape is not subtle. Take Pai: a July mean of 3.0 micrograms per cubic metre, a December mean of 9.9, a March mean of 26.1, an April mean of 29.8. Thirty of the thirty April days measured sat above 35.4 µg/m³, the figure the United States uses as its 24-hour standard. In July, across four years, not one day did.
The same shape repeats at every point on the circuit, and one thing about it is worth saying out loud: Chiang Mai is worse than the loop. Chiang Mai's March mean is 37.8 µg/m³ against Mae Hong Son's 29.1 and Pai's 26.1. The city you leave from is the dirtiest air on the route.
Where the long record fails. In 15,050 point-days the model never once produced a daily mean above 99.4 µg/m³. Ground stations in northern Thailand have recorded far higher. A model cell is tens of kilometres across; a Mae Hong Son valley on a windless March morning is not, and the averaging that makes a continental model tractable is exactly the averaging that removes the worst hour of the worst day. Inference — read the monthly shape from this data and do not read the ceiling from it.
The ground record, such as it is. Thailand's Pollution Control Department runs a national network and publishes the current hour. Its historical endpoint returned 404 on the fetch date, so what this site can show from it is now, not then. And there is a second problem, which is a finding in itself: Mae Hong Son province — 12,765 square kilometres, the largest by area in the north — has one station. It is 58t, in Mae Hong Son town. Pai has none. Soppong has none. Khun Yuam, Mae La Noi and Mae Sariang have none. Nobody official is measuring the air in the town most riders sleep in on night one.
How
The practical version. February is not the problem up-country: Pai's February mean is 15.0 µg/m³ and no February day in four years cleared 35.4 there. March and April are. May is over — Pai drops to 10.0 and stays down. If the dates are fixed and they land in March, the ride is still rideable; what changes is that a viewpoint is a white wall, a long descent is done with stinging eyes, and anyone with asthma is having a bad week. A fitted FFP2 or N95 under the helmet is the mitigation people use; a surgical mask and a buff are not filtering PM2.5.
Now
Inference — the scheduling advice this data supports reverses the usual one. The cool season is sold as the season, and November to February is genuinely lovely. But the cleanest air on this circuit by a wide margin is the rains — Pai at 3.0 µg/m³ in July against 26.1 in March — and the hills are green, the waterfalls are running and the rooms are cheap. What you trade is dry tarmac.
Runs with
- storyThe season picks the direction — What the smoke does to the choice of direction.
- eventBurning season — The season itself, as a date range.
- eventThe rains — The cleanest air of the year, and the wettest road.
- eventThe cool season — The season everyone books, and why.
- townPai — The town with no air monitor and the softest March of the circuit.
- townChiang Mai — The dirtiest air on the route, and where you start.
- hazardRiding in the smoke — Riding in it: what it does to sight and to lungs.
- termPM2.5 — What the number measures.
Named here by
- townChiang Mai — The dirtiest air on the route is here.
- townMae Hong Son — The one air monitor in the province is here.
- townPai — Why the basin matters, and what the numbers say.
- hazardRiding in the smoke — The four years of measurements behind this.
- eventBurning season — The data and where it is weak.
- termPM2.5 — Four years of it, measured.
- storyThe season picks the direction — The four years of figures behind the March advice.
Where each claim comes from
| Field | Tier | Source | Note |
|---|---|---|---|
| default | harvested | Open-Meteo Air Quality API (Copernicus CAMS) — Open-Meteo | |
| text.story | harvested | Open-Meteo Air Quality API (Copernicus CAMS) — Open-Meteo | every figure is computed by tools/harvest_air.py from the fetched series; the station count is read off the air4thai station list on the fetch date |
| text.how | inference | the mask advice is this project reasoning from what PM2.5 is; no clinical source is cited for it and none should be read into it | |
| text.today | inference | ||
| text_th | inference | written in Thai by this project, not machine-translated |
Sources
- Open-Meteo Air Quality API (Copernicus CAMS) — Open-Meteo
- air4thai — national air quality monitoring network — Pollution Control Department, Thailand / กรมควบคุมมลพิษ
- Final Reconsideration of the National Ambient Air Quality Standards for Particulate Matter — US Environmental Protection Agency
- Southeast Asian haze — Wikipedia (en)
- Mae Hong Son province — Wikipedia (en)
cited Cited — a named source, linked · harvested Harvested — fetched from an open dataset, with its licence · tradition Tradition — general knowledge of the tradition, hedged · inference Inference — this project's own reasoning from the above · field Field — someone stood there